Managing Texas Energy Prices with ERCOT: A Guide for Homeowners
If you've noticed that energy prices in Texas can fluctuate significantly with changes in the weather, you're not alone. The Lone Star State’s unique weather patterns, combined with its independent electricity grid, mean that we have a dynamic pricing environment. In this article, we'll look at how you can use data from the Electricity Reliability Council of Texas (ERCOT) to better understand and predict energy costs… even during extreme weather.
What is ERCOT, and How Does It Manage the Texas Energy Grid?
The Electricity Reliability Council of Texas (ERCOT) is the governing body responsible for managing the flow of electricity to more than 26 million Texas customers. ERCOT’s power grid is unique because it operates independently from other U.S. grids, allowing them to manage energy demand and pricing with real-time responsiveness to local conditions, including Texas' volatile weather. Learn more about the in's and out's of Texas power production here.
How Does Weather Influence Energy Prices in Texas?
Texas is known for weather extremes, ranging from intense summer heatwaves to rare winter freezes, and these fluctuations in weather can greatly impact energy demand and pricing.
During Heatwaves
During hot Texas summers the demand for air conditioning surges, increasing electricity usage. This increased demand can strain the grid, leading to higher prices especially during peak hours (typically 3 p.m. to 7 p.m.).
During Winter Storms
Cold snaps can also have dramatic impacts on energy pricing. During Winter Storm Uri in 2021, demand spiked as people cranked up the heat. To make matters worse, this happened while icy conditions had taken a significant portion of the grid offline, leading to unprecedented price surges.
How to Use ERCOT’s Dashboards to Monitor and Predict Energy Costs
ERCOT’s dashboards, found at this link on their website, provide real-time and historical data about the Texas energy grid. Understanding ERCOT’s dashboards and the relationship between weather, demand, and energy prices can help you make informed decisions about your electricity usage. By regularly monitoring ERCOT’s data, you can even adapt to changing conditions, save on energy costs, help contribute to a stable grid – and maybe lower your monthly bill.
Supply and Demand
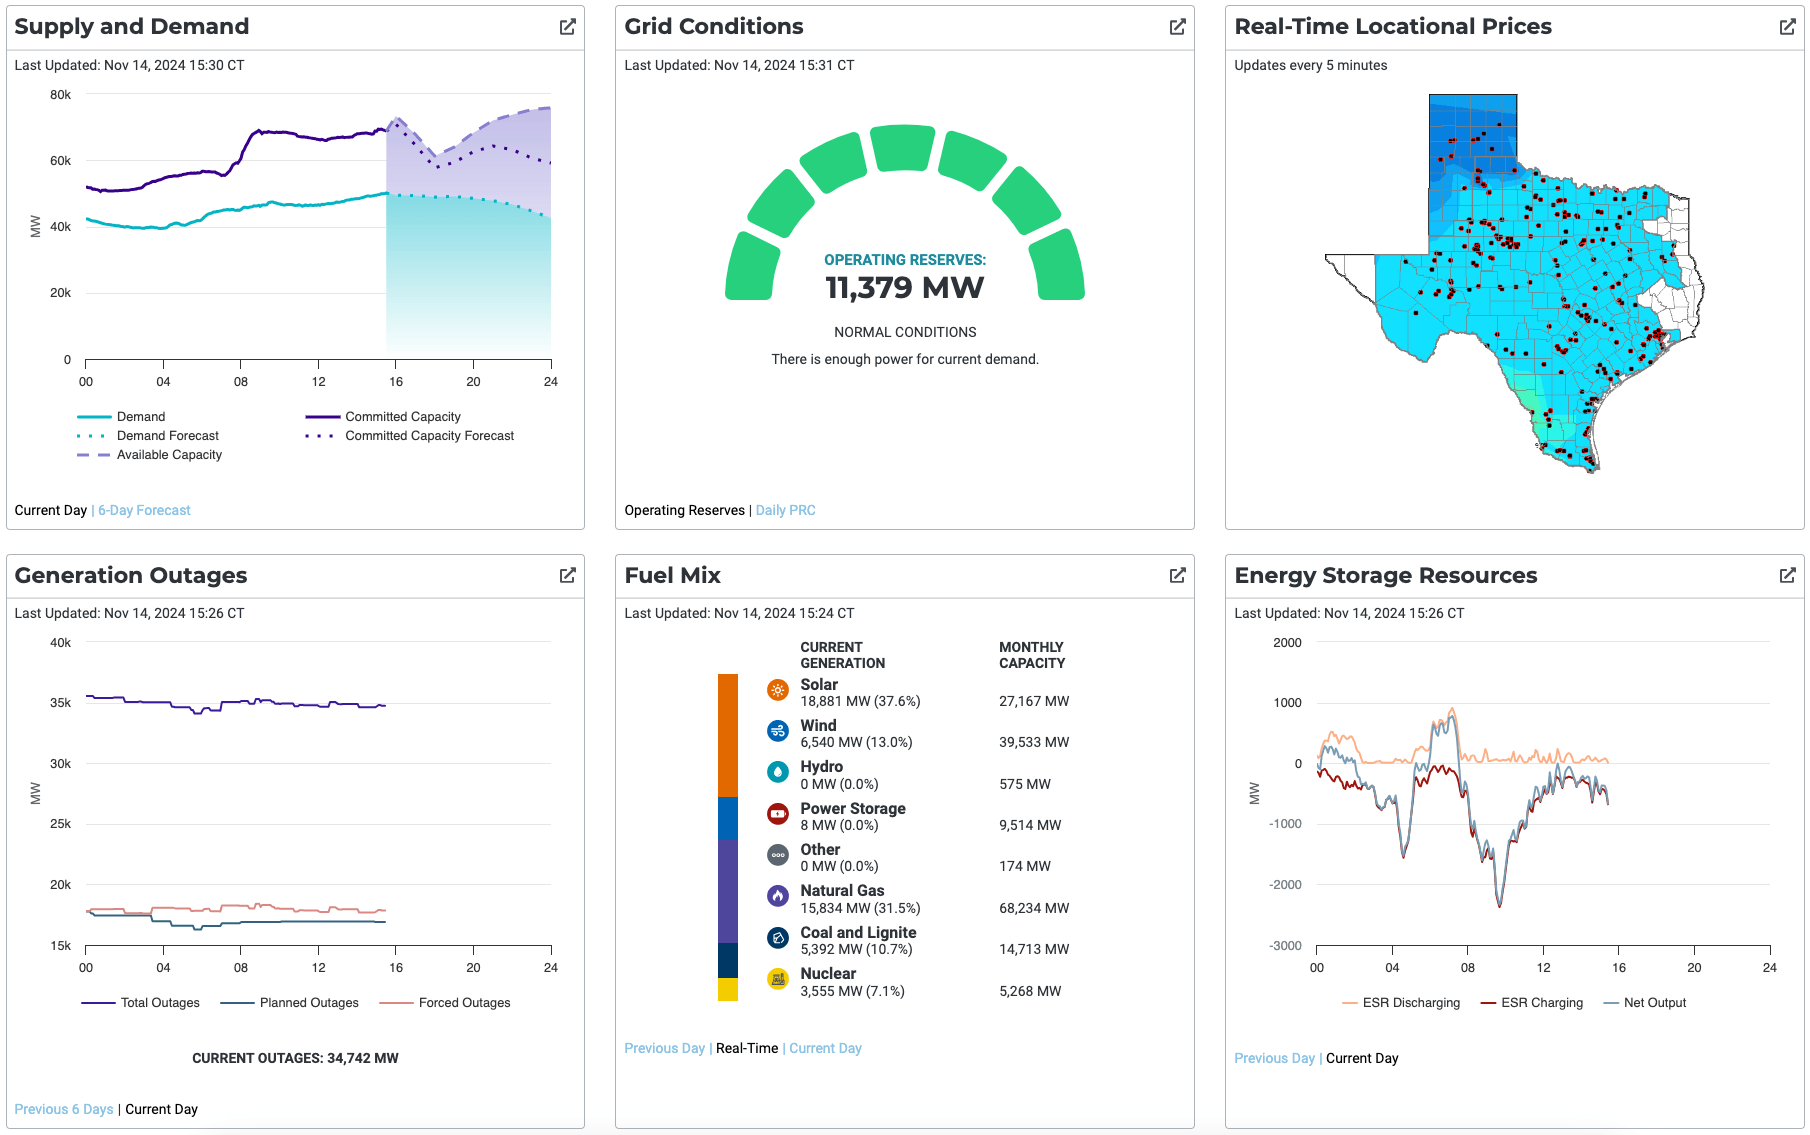
The Supply and Demand dashboard shows both current and historical electricity demand levels across Texas.
Current Demand: Displays real-time demand across the ERCOT grid. Observing the day’s peak and off-peak hours can help you time your energy usage to avoid the most expensive hours.
Historical Trends: View trends in electricity usage over time (daily, weekly, and seasonal) to see when prices are likely to spike. For instance, you’ll often notice peak usage during summer afternoons and winter mornings, bringing higher prices.
Regional Differences: Different parts of Texas experience varied weather patterns, leading to regional differences in usage. Understanding your area’s usage trends can help you predict when local conditions might drive prices up.
Grid Conditions: Stability and Capacity
The Grid Conditions dashboard tracks how close the grid is to reaching its maximum capacity.
Operating Reserves Meter: Shows the grid’s current stability by displaying the amount of operating reserves, or “extra” capacity beyond current demand. Lower reserves indicate the potential for higher prices as well as requests for reduced energy consumption.
Daily PRC: This graph displays the Physical Responsive Capability (PRC), or the grid’s total resources that are online in real time. A high PRC means the grid has a reassuring cushion of available resources, while a low PRC can mean that price increases are coming, due to strain on the grid.
Real-Time Locational Prices
ERCOT’s real-time locational price dashboard gives insight into electricity pricing across Texas, in real time. Since price spikes are generally linked to high demand or limited supply, monitoring this dashboard during extreme weather events can help you anticipate when prices might soar and adjust your usage as appropriate.
Generation Outages
This dashboard shows planned and forced generation outages. When a large portion of power generators are offline (for maintenance or due to unexpected failures), supply goes down and prices may go up. Tracking outages can help you predict periods of potential grid strain, especially during times of high demand.
Fuel Mix and Renewable Energy Sources
Texas is a national leader in wind energy and has significant solar generation. However, the inherent variability of these sources poses challenges for ERCOT. To integrate renewable energy effectively, ERCOT relies on real-time data and advanced forecasting to balance the grid. As more storage solutions like batteries are integrated into the grid, ERCOT’s ability to buffer against renewable intermittency will improve, ultimately making the grid more resilient and stabilizing prices over time.
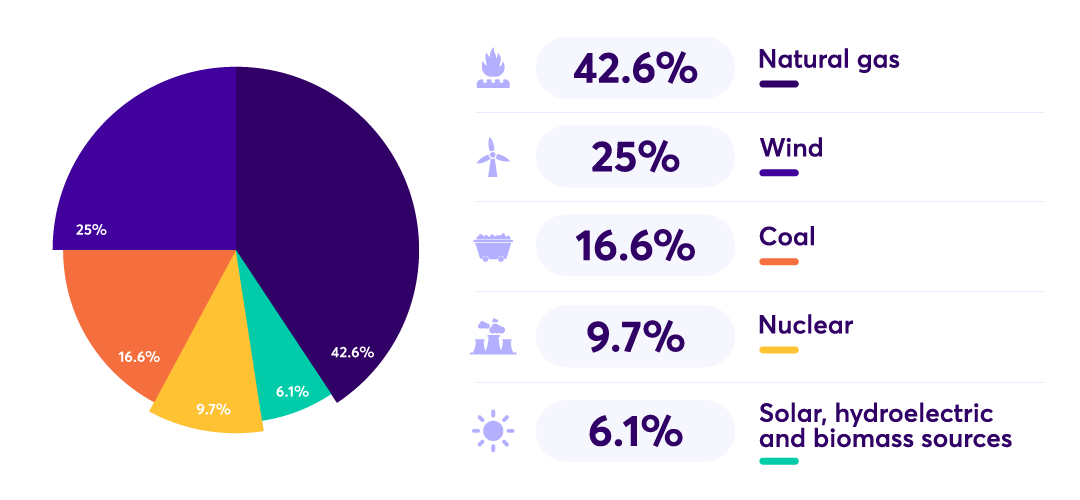
In this dashboard, ERCOT provides a detailed look at the fuel mix in Texas' electricity generation, including coal, natural gas, wind, solar, and nuclear power. With renewable sources like wind and solar making up an increasing share of the grid, the impact of time of day and weather on energy costs is growing:
Wind and Solar: Wind generation is typically higher at night and in the early morning, while solar peaks when the midday sun is shining. During extreme weather, renewable output might decrease – think cloudy days for solar or still days for wind – leading to an increased reliance on fossil fuels and higher costs.
Energy Storage Resources: As Texas integrates more storage options like large batteries into the grid, it can better offset fluctuations in renewable power, reducing price volatility during extreme weather events.
System-Wide Demand: Real-Time and Forecasted
The System-Wide Demand dashboard shows the current balance of power supply and demand, using both real-time data and forecasts. Forecasting is key during extreme weather! If demand is projected to spike, ERCOT may issue advisories for voluntary reduction in consumption to prevent grid strain. Homeowners can use these forecasts to plan their energy use proactively.
How to Predict and Manage Your Energy Costs
Use Weather Forecasts
First of all, keep an eye on upcoming weather. Extreme weather forecasts, whether high temperatures or cold fronts, often mean that both electricity demand and prices will rise. Using ERCOT’s historical demand data alongside weather trends can provide clues as to when price spikes may occur.
Understand Demand and Pricing Relationship
As a general rule, higher demand leads to higher prices. ERCOT's locational prices and system demand graphs can help you understand when and where demand is highest, opening up opportunities for you to adjust your usage, to avoid peak pricing.
Respond to ERCOT’s Alerts and Grid Conditions
When ERCOT declares conservation requests during times of grid strain, reducing your energy use can prevent costly surges. Simple actions like raising your thermostat a few degrees in summer can lead to savings and help stabilize the grid.
Taking Control of Energy Usage with ERCOT Data
The insights from ERCOT’s dashboards aren’t just for utility companies or policymakers, they’re valuable for homeowners too. By understanding when demand is highest and adjusting your energy use, you can minimize costs and contribute to grid stability.
Shift Usage to Off-Peak Hours
If you run major energy draws like the dishwasher and laundry or charging electric vehicles during off-peak hours, you can save money and reduce grid strain. ERCOT’s supply and demand dashboard can help you identify the best times to use electricity.
Monitor Renewable Generation
During peak solar and wind generation times, grid strain can be lower, and prices may drop. Checking ERCOT’s fuel mix dashboard can help you time energy usage to take advantage of renewable power availability.
Does Rhythm Energy Offer Residential Plans That Protect Against Price Fluctuations?
Absolutely! Rhythm Energy offers fixed-rate plans that lock in electricity prices for a set period, shielding you from market fluctuations. In contrast, variable-rate plans may expose customers to price spikes during periods of high demand. To learn more about fixed rate plans from Rhythm Energy, read our article on Fixed Rate Electricity Plans in Texas for Predictable Bills.
FAQ
What is ERCOT?
The Electricity Reliability Council of Texas (ERCOT) manages electricity distribution to 26 million Texans, overseeing the grid.
Why do energy prices fluctuate so much in Texas?
Weather is a major factor! Both extreme heat and cold snaps can lead to spikes in energy usage, and so energy prices.
How can the ERCOT dashboards help me reduce energy usage (and bills)?
The dashboards on the ERCOT website are remarkable tools that give both real-time and historical data about the power grid. On them, you can explore the impact of the weather, demand, energy prices, and more to help you make smart choices about your own electricity usage.
