As ERCOT market participants anticipate the Value of Lost Load (VOLL) study results by summer 2024, interest in the repercussions of VOLL adjustments is heightened. Concerns focus on their effects on wholesale pricing, market dynamics, and end-use consumers. With substantial shifts in ERCOT's landscape since the last economic valuation of lost load in 2013—marked by the energy transition, technological progress, and market design evolution—the need for an updated VOLL analysis is unmistakable.
This article pursues two objectives:
(1) to present a commercial methodology for developing a digital twin of ERCOT's scarcity pricing engine, utilizing ERCOT nodal protocols to enable market participants to assess the impact of modifications to the Value of Lost Load (VOLL) on price formation; and
(2) to advocate for the timely recalibration of VOLL, in conjunction with the most market- or data-driven parameters of market design. Although an elevated VOLL might amplify volatility and scarcity pricing, it benefits the market by ensuring that price formation and other critical elements of market design are accurately calibrated to reflect the current market conditions. We will assume that all other variables are kept unchanged and System-Wide Offer Cap remains at $5,000/MWh and therefore decoupled from VOLL. This is key since historically there has been evidence that Energy Offer Curves do not correctly/appropriately reflect value of reserves during certain key intervals.
Through various scenarios, we analyze the impact of VOLL adjustments on Real-Time prices for summer 2023. Utilizing a Python-based digital twin of ERCOT’s ORDC engine, we find that increasing VOLL from $5,000/MWh to $10,000/MWh would quintuple the ORDC scarcity pricing adder, RTORPA, in August and September 2023. It's noteworthy that rises in VOLL and scarcity pricing should not be viewed negatively by end-users. Indeed, a market with well-designed and precisely calibrated parameters is crucial. This ensures the market correctly signals when actions are necessary for reliability and resource adequacy.
Impacts to summer 2023 ATC Real-Time Settlement Point Prices:
“RTORPA_Current” is the ERCOT settled value of RTORPA and is shown as a benchmark.
Scenario | Aug 2023 | Sep 2023 |
|---|---|---|
RTORPA_Current | $7 | $3 |
RTORPA_VOLL_10000 | $33 | $17 |
RTORPA_VOLL_15000 | $59 | $31 |
RTORPA_VOLL_15000_2x_LOLP_SigmaMean | $121 | $64 |
Understanding Value of Lost Load (VOLL)
VOLL, or Value of Lost Load, quantifies the economic value of electricity to end-users, especially as it relates to outages due to insufficient reserve capacity. Recognizing that the perceived value of electricity varies across customer classes—based on business operations, lifestyle, or essential needs—VOLL estimation employs methods like end-user surveys, enhanced by regional or macroeconomic benchmarking. The goal is to derive a unified VOLL through statistical means (or other metrics), representing electrical load as a singular, homogenous asset across diverse user groups.
Relationship between VOLL and ERCOT's Scarcity Pricing Engine
In ERCOT, real-time electricity pricing incorporates an "administrative" component that uses economic theory to reflect supply-demand dynamics. The Operating Reserve Demand Curve (ORDC) functions as this component, introducing a price adder, the Real-Time On-Line Reserve Price Adder (RTORPA), to the Locational Marginal Price (LMP). This adder ensures that prices truly signify supply shortage conditions and integrates into the Real-Time Settlement Point Price (RT-SPP).
The Value of Lost Load (VOLL) significantly impacts the RTORPA adder's computation. However, before delving into specifics, we aim to conceptually develop our "administrative" price adder. This involves a qualitative analysis, taking into account various dimensions of ERCOT's market design and historical context:

ERCOT is an energy-only market, hence energy pricing must support an appropriate level of investment in resources. |
When operating reserve capacity is low, probability of load shed and scarcity event increases. |
Final system prices should reflect the marginal value of available operating reserves because reserves reduce the probability of load shed event. |
Energy and Ancillary Services (AS) are not co-optimized by ERCOT's Security Constrained Economic Dispatch (SCED) in real-time market. AS is procured in day-ahead market and if adjustments are needed in the Supplemental AS Market (SASM). |
Resources that are awarded AS (therefore have AS Responsibility) reserve the AS MWs. |
The MWs reserved for AS are therefore not available to real-time SCED unless released by SCED through AS deployments or other ERCOT processes. |
Due to above, high prices during scarcity events have to be driven by higher priced Energy Offer Curves. |
Historically there has been evidence that Energy Offer Curves do not correctly/appropriately reflect value of reserves during certain key intervals. |
Therefore there is a need for an administrative adder to signify importance and value of reserves. |
At the core of ERCOT's current scarcity pricing market design (which has been in place for a decade now) is a simple but effective economic assumption:

Newcomers to ERCOT should note that the ERCOT’s scarcity pricing construct doesn't limit operating reserves to Ancillary Services (AS) alone. Operating reserves refer more generally to the extra capacity that is available in Real-Time, either online (RTOLCAP) or offline (RTOFFCAP) and can include: AS that has not been deployed, headroom on Resources that are not providing AS, or extra headroom on Resources that are providing AS.
Now that we have concluded that value of real-time operating reserves is equivalent to the value of avoiding load shed, how do we model the value of “avoiding” load shed? Despite estimating VOLL through surveys and benchmarking, further analysis is needed to determine the value of preventing load shedding events. With the construct above in mind we can decompose value of load shed to two key components:
Probability of load shed for each MW of operating reserve availability
Value of Lost Load
By multiplying the load shed probability values by VOLL, we are able to create a dollar per MW value for each level of operating reserve availability.
A short piece of history: ERCOT’s initial goal was to develop a real-time SCED that co-optimized energy and AS utilizing AS demand curves, but an alternative approach was developed for much lower cost which was viewed to provide adequate scarcity pricing benefits akin to real-time co-optimization but without the need for true real-time co-optimization! This is the market design which is currently in place and was implemented in 2013. This current market design is set for an overhaul with the planned introduction of a real-time co-optimized SCED, including AS demand curves, as part of the RTC+B initiative in 2026.
Estimation and Modelling of ORDC
Having defined the value of real-time operating reserves as the value derived from avoiding load shedding, we then segmented this value into two primary elements: the Probability of Load Shed and the Value of Lost Load. Our next step involves calculating each element and their combined effect to formulate price adders reflective of the Operating Reserve Demand Curve (ORDC). For clarity and alignment with ERCOT standards, we will henceforth refer to the Probability of Load Shed as the Loss of Load Probability (LOLP).

1) Loss of Load Probability (LOLP):
LOLP for a given level of available Real-Time reserves is the probability of an event that can exceed the level of available Real-Time reserves. If such an event occurs, it will lead to firm load shed. This probability is shaped by the stochastic nature of load forecast errors, intermittent renewable resource forecast errors, and unexpected resource outages. ERCOT utilizes the variability in forecasted reserve errors—derived from the Hour-Ahead Reliability Unit Commitment (HRUC) process—as a stand-in for these combined uncertainties.
To capture the LOLP, ERCOT analyzes reserve forecast error statistics—mean and standard deviation—across different seasons and time blocks, assuming a normal distribution for these errors. This assumption allows for the calculation of LOLP for any given interval using the Cumulative Distribution Function (CDF) of the normal distribution. But there is one more item that needs to be considered before we can formulate our LOLP model. ERCOT starts to take out-of-market actions well in advance of available reserves approaching zero. The impact of these actions must be reflected in ORDC. A reserve Minimum Contingency Level (MCL), which is currently set to 3000MW, is selected and LOLPs for reserve levels below MCL are administratively set to 1. Additionally, the LOLP curve is shifted to the right by the MCL amount. See Plot #1.
Building on this foundation, we define a Python function (named “pbmcl” standing for: probability of reserves falling below minimum contingency level) to calculate the probability of exceeding the MCL, incorporating the MCL's impact on the probability of load shedding for different reserve levels. This function, central to developing our digital twin of ERCOT's scarcity pricing model, leverages mean, and standard deviation of hour-ahead reserve forecasts, reserve levels, and additional parameters to model the LOLP accurately. See Code Block #1.
Code Block #1
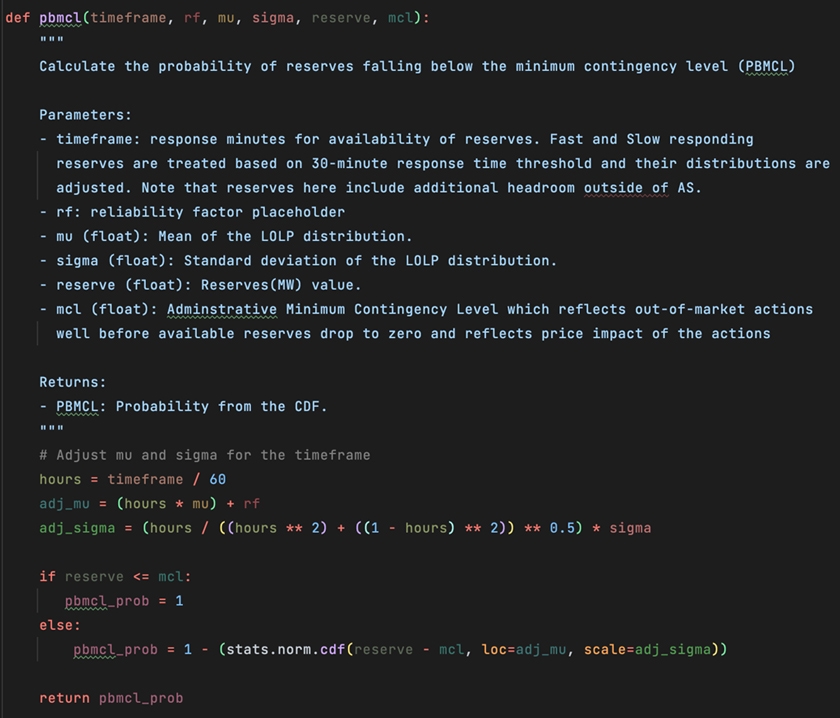
Equipped with the ‘pbmcl’ function, which outputs probabilities for loss of load, we can now create a simulation for a range of reserve scenarios. We will use mean and standard deviation of hour-ahead reserve forecast errors that ERCOT published for summer 2023: mu=860.9 MW and sigma=1288.9 MW. Plot #1 that illustrates the outcomes for different MCL scenarios.
Plot #1
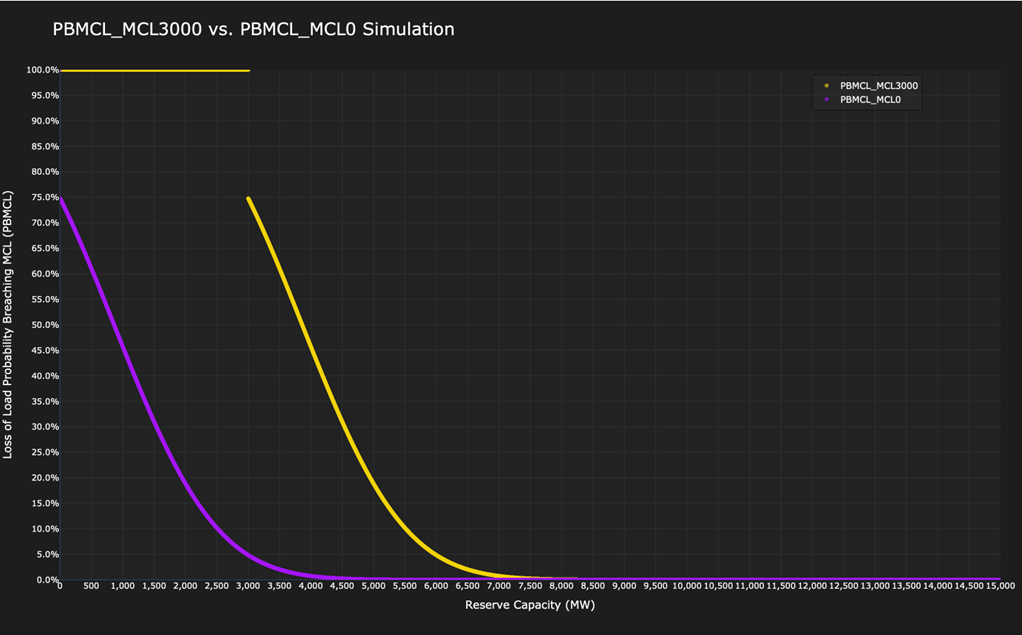
In the purple scenario, we assume there is no administrative Minimum Contingency Level (MCL), effectively setting MCL to 0. This results in a curve that mirrors a typical Cumulative Distribution Function (CDF) for a normal distribution, based on the specified mean and standard deviation for summer 2023. This scenario illustrates a pure CDF for the Loss of Load Probability (LOLP), indicating, for instance, that a reserve level of 2500MW corresponds to a 10% probability of load shedding. The yellow curve, however, introduces adjustments for the administrative MCL (set at 3000MW), reflecting ERCOT's preemptive out-of-market actions to mitigate higher load shed probabilities as reserves decrease.
2) VOLL (currently set to $5,000/MWh per nodal protocols):
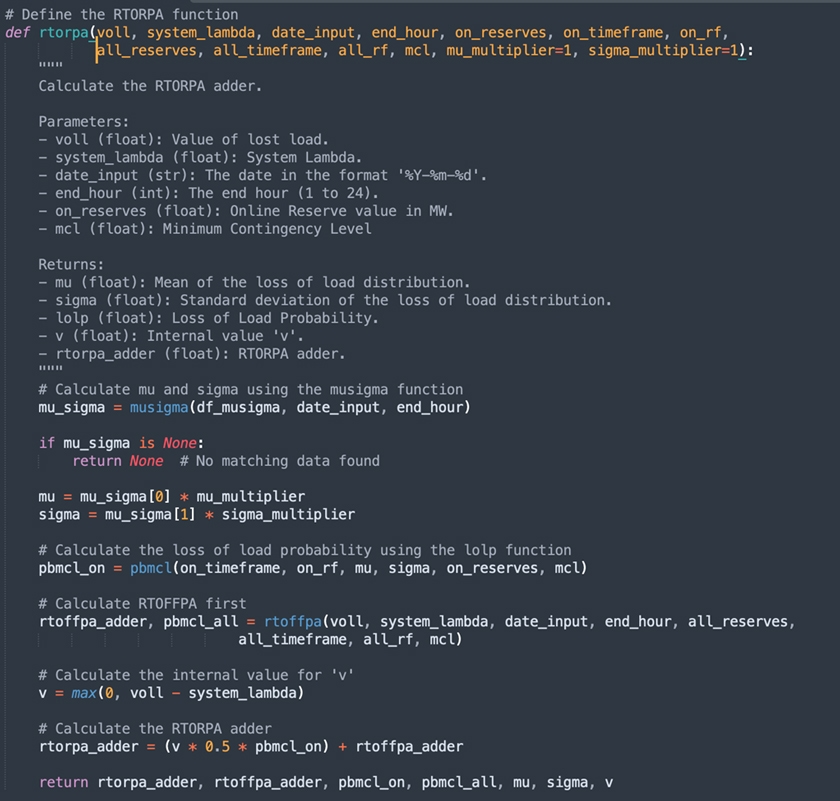
The PBMCL model calculates the probability of load shedding for varying reserve levels, necessitating the inclusion of the Value of Lost Load (VOLL) to transform these probabilities into monetary price adders ($/MWh). ERCOT categorizes reserves into slow (RTOFFFCAP) and fast (RTOLCAP) responding groups. The Real-Time Offline (RTOFFPA) and Online (RTORPA) Price Adders emerge from this model, correlating with the respective reserve capacities:
RTORPA: Represents the value of the Real-Time On-Line Reserve Capacity (RTOLCAP) able to respond immediately following an event
RTOFFPA: Represents the value of the Real-Time Off-Line Reserve Capacity (RTOFFCAP) not currently available but could be in 30 minutes
These two price adders are essentially the product of PBMCL probability outputs and VOLL value (which is currently set to $5000/MWh). Note that a scaler value (named timeframe in our implementation of the Python ORDC) is used to scale the distributional impacts of response time of each reserve category on the loss of load probabilities. Lastly, the final RTORPA price adder is designed to include RTOFFPA while ensuring the sum of the price adder value and System Lambda does not go above VOLL. See Code Block #2.
Code Block #2
Validating the ORDC Model
Before examining the effects of different VOLL scenarios on scarcity pricing, it's crucial to verify that our ORDC pricing engine accurately replicates ERCOT's settled price adders. This involves comparing our model's RTORPA output against ERCOT's published RTORPA adders for August and September 2023. An exact match of RTORPA values for all 5-minute SCED intervals will confirm the precision of our model. See Plot #2.
Plot #2
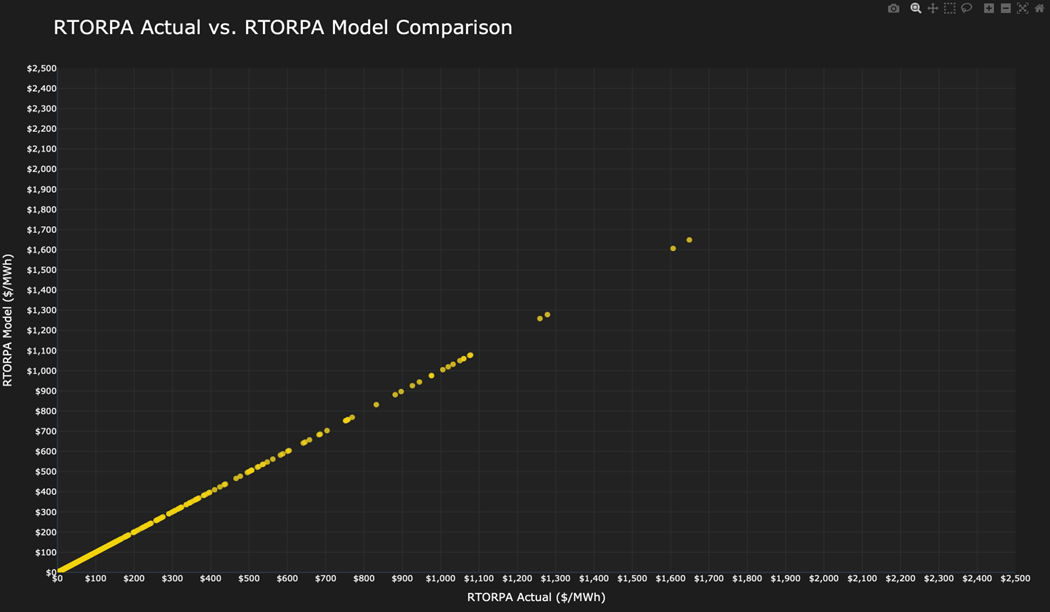
Our model aligns precisely with ERCOT's, as expected. Given that the ORDC is based on ERCOT's established protocols and statistical principles, this match confirms our model's accuracy. We are now equipped to explore how regulatory changes to VOLL could influence scarcity pricing and Settlement Point Prices.
Exploring the Effects of Increased VOLL on Scarcity Pricing
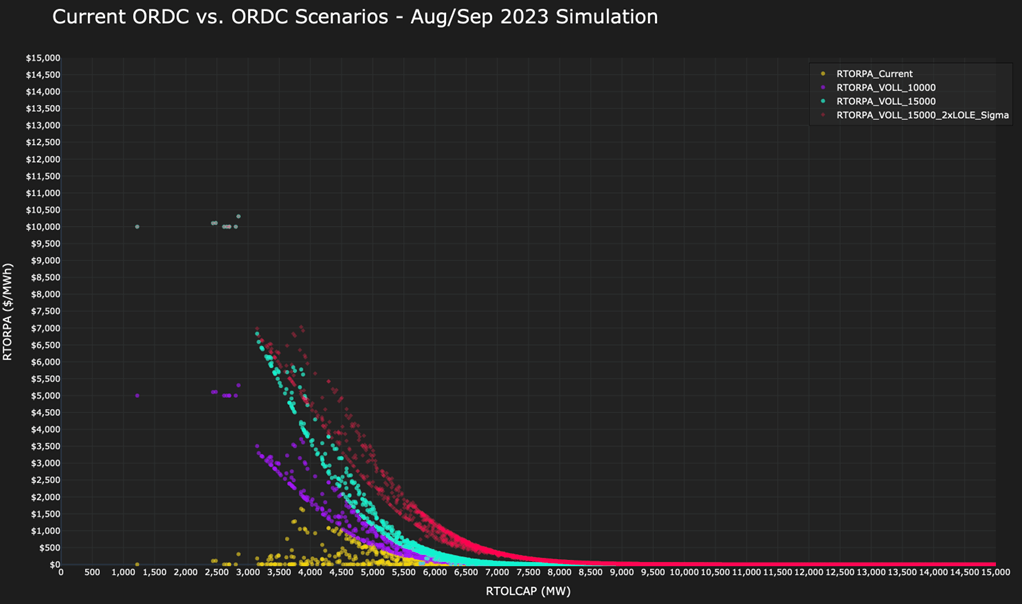
This section explores the potential impacts of raising VOLL on summer 2023’s scarcity pricing. We examine three hypothetical VOLL adjustments through our ORDC digital twin:
VOLL at $10,000/MWh,
VOLL at $15,000/MWh,
VOLL at $15,000/MWh with a doubled LOLP standard deviation and mean.
We analyze how these changes could affect the Real-Time Settlement Point Prices, offering insights into the resultant ORDC’s RTORPA values and their addition to LMPs for price determination. We will assume that all other variables are kept unchanged and System-Wide Offer Cap remains at $5,000/MWh and therefore decoupled from VOLL. Other pricing components such as Reliability Deployment Price Adder (RTORDPA), Power Balance Penalty Curve Cap, Shadow Price Caps, Shift Factors, System Lambda/Offer Curves or other circuit breaker mechanisms are also assumed to stay unchanged.
We calculate the following price impacts (see table below and Plot #3) to summer 2023 ATC Real-Time Settlement Point Prices. These are ORDC’s RTORPA values and should be added to LMPs to arrive at final real-time settlement point prices for each scenario. The RTORPA_Current scenario reflects the RTORPA adder as settled this summer.
Scenario | Aug 2023 | Sep 2023 |
|---|---|---|
RTORPA_Current | $7 | $3 |
RTORPA_VOLL_10000 | $33 | $17 |
RTORPA_VOLL_15000 | $59 | $31 |
RTORPA_VOLL_15000_2x_LOLP_SigmaMean | $121 | $64 |
Plot #3
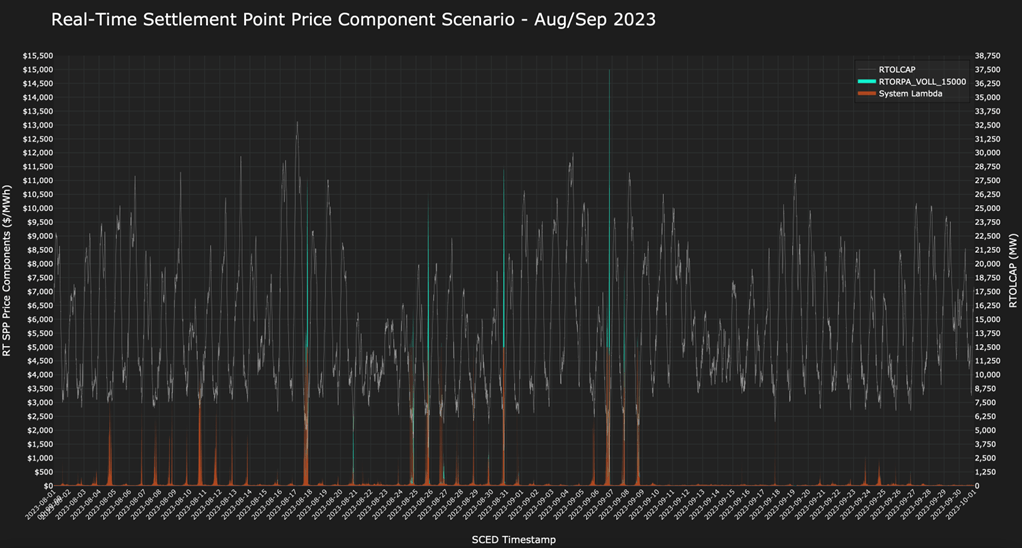
The plot below (Plot #4) shows the price formation during summer 2023 for the RTORPA_VOLL_15000 scenario, along with Real-Time Online Reserve Capacity (RTOLCAP) in MWs on the secondary y-axis on the right side of the plot.
Plot #4
Concluding Insights and Future Considerations
This article underscores that revisions to ERCOT protocol parameters, including VOLL, are likely to impact pricing mechanisms beyond the direct effects analyzed here. Adjustments in parameters such as the System-Wide Offer Cap or Shadow Price Caps could further influence price formation. Additionally, the introduction of the RTORDPA adder in 2015, aimed at mitigating price distortions resulting from reliability actions during scarcity events, illustrates the complexity of maintaining market balance and incentivizing resource availability. This complexity highlights the ongoing need to evaluate and adjust market mechanisms to ensure reliability and efficient price signals.
References:
Various ERCOT filings and publications
Electricity Scarcity Pricing Through Operating Reserves: An ERCOT Window of Opportunity (William W. Hogan November 1, 2012)

